April 2020
DIR Calculator
Flask, WebSockets, Jinja2, d3.js & Diving!
A Diving calculator project started due to covid-19 lockdown boredom, with Flask & d3.js. For non-divers I will try to explain briefly what this is all about.
Doing it Right(DIR) is an approach to scuba diving aiming to unify procedures & equipment among divers, hence making their diving more efficient, safer and enjoyable.
One of many calculations needed for a dive is Minimum Gas which is what this app is about.
Minimum Gas specifies the amount of gas needed in an event of a diver running out-of-gas(OOG) for two divers to share the same breathing source(cylinder) and ascend to the depth where OOG diver can breath his next available gas source or reaching the surface.
Diver’s input:
Depth: Maximum depth of the dive
Solving time: Time needed to adress the incident of a diver being OOG and start ascending. The more time spent solving the problem,the more gas is consumed, the more stress… 💩 hits the fan. The bigger this number is, more litres(L) of gas are added to Minimum Gas.
Gas Switch: Next available gas source of OOG diver or Surface. This defines the target depth where OOG diver can breath again on his own.
Info Displayed:
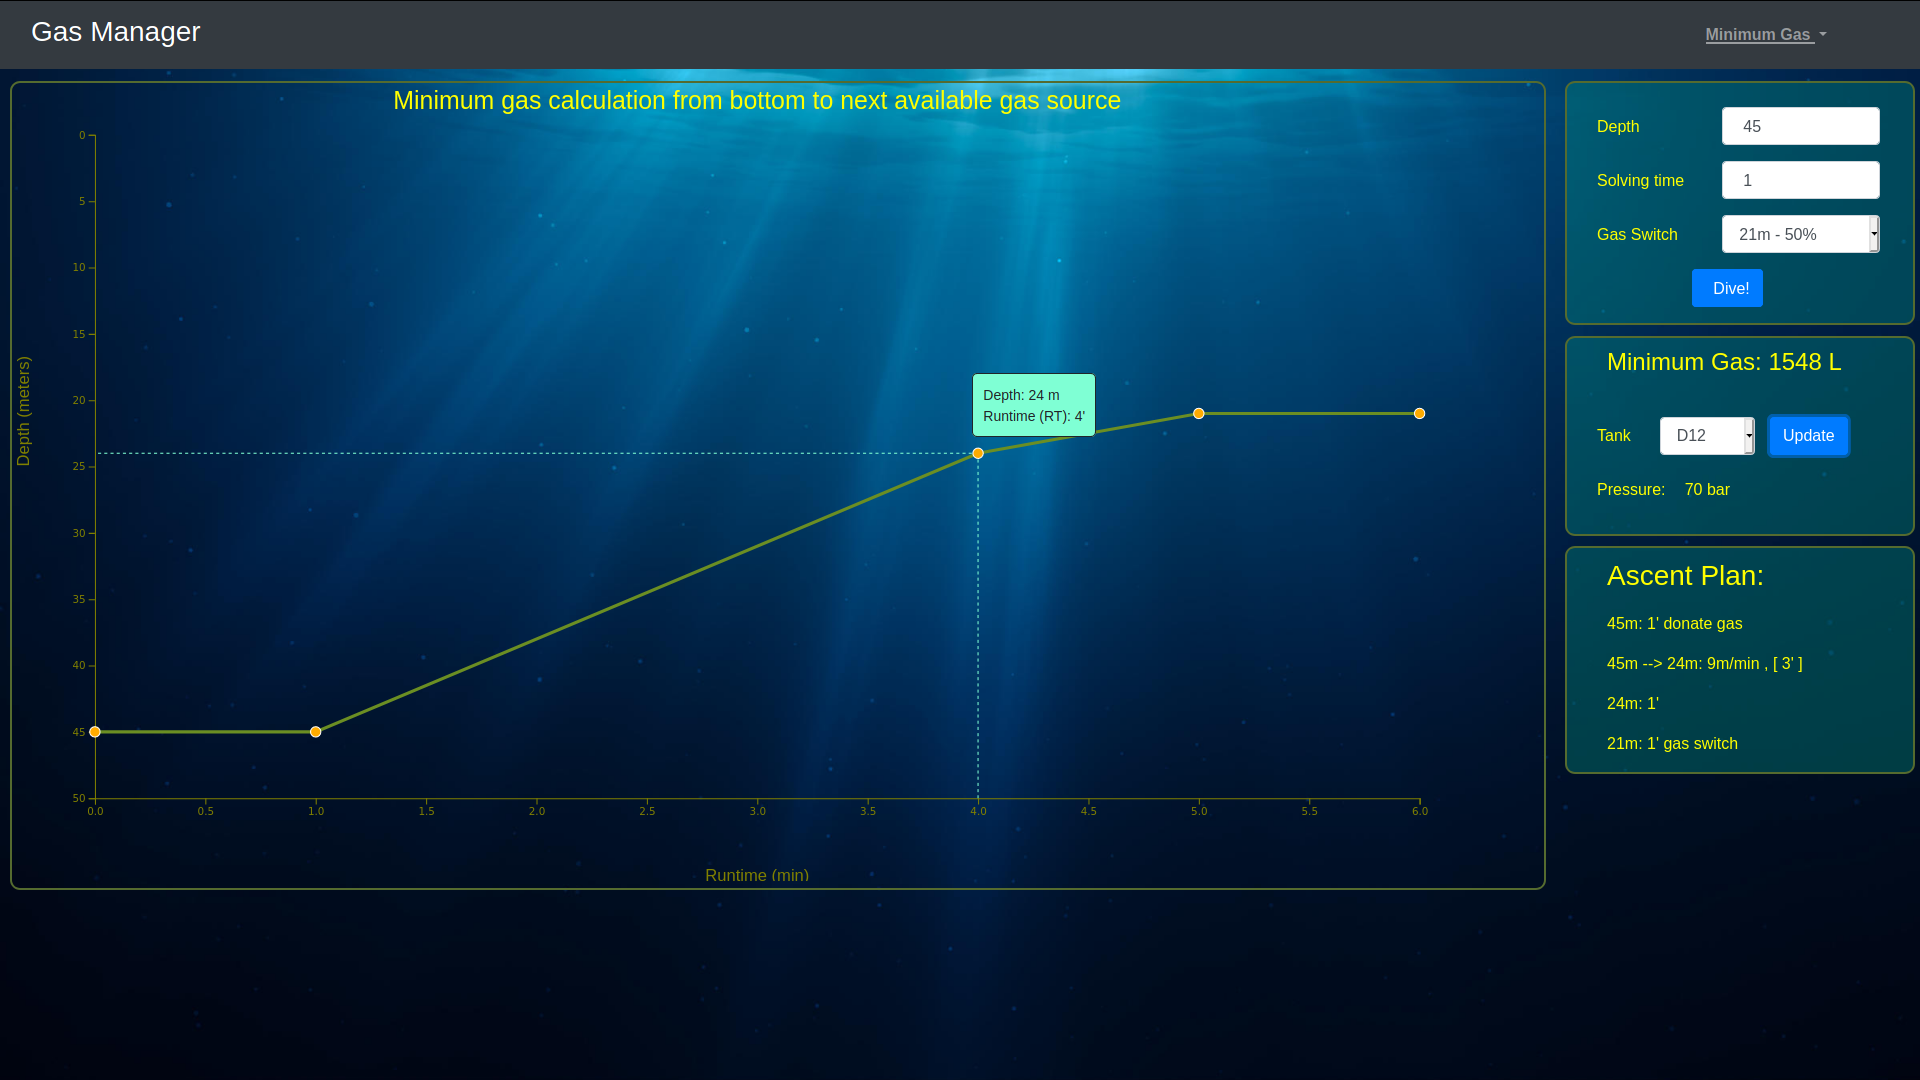
Minimum Gas: Litres of gas based upon above variables. Litres converted to pressure(bar) according to the volume of diver’s cylinder. Diver can select his cylinder and update the pressure reading to that size of volume.
Ascent plan: A brief allocation per depth stop of total time needed to ascend safely to the depth defined by Gas Switch.
Chart: Chart displaying the ascent profile from bottom to next Gas Switch. Made with D3.js
D3.js
Since I ’ve started coding, I wanted to make such a chart for a dive profile. A friend mentioned D3.js. Being stucked at home during covid-19 lockdown period I spent many days reading existing examples and trying existing solutions to figure out how that works.
Eventually I borrowed an existing chart example and modified it to fit the purpose. As a true newbie in the field, such modifications required many overnight stackoverflow searching, until I reached a point it worked.
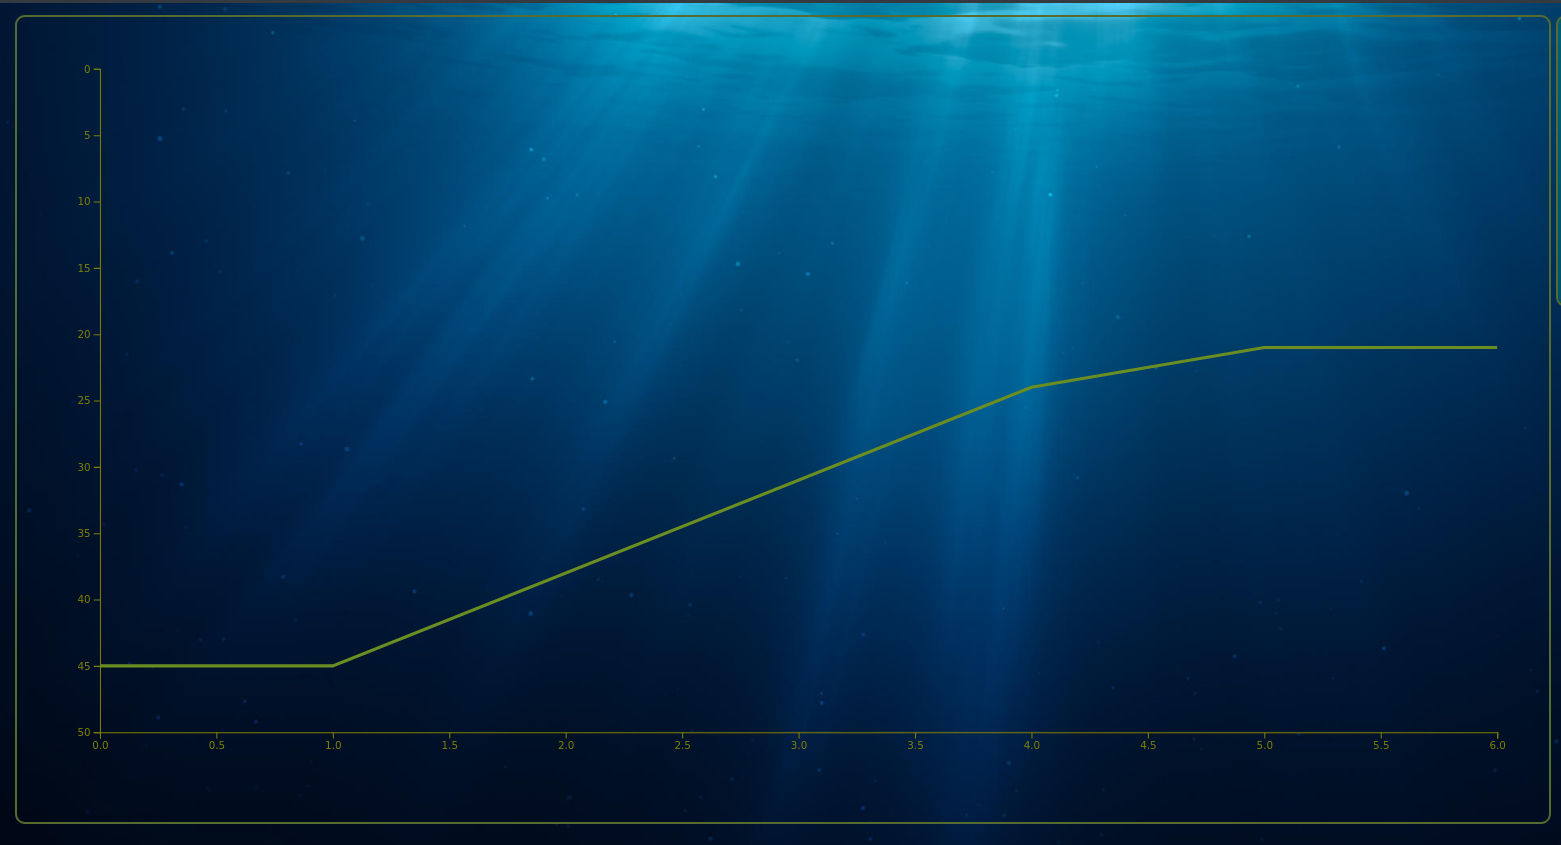
Initially the chart looked like this.

Additionally to visual info like Chart title, axis titles, circles at data points, I wanted to add a tooltip with lines pointing to axis coordinates as user moves the mouse over a point.
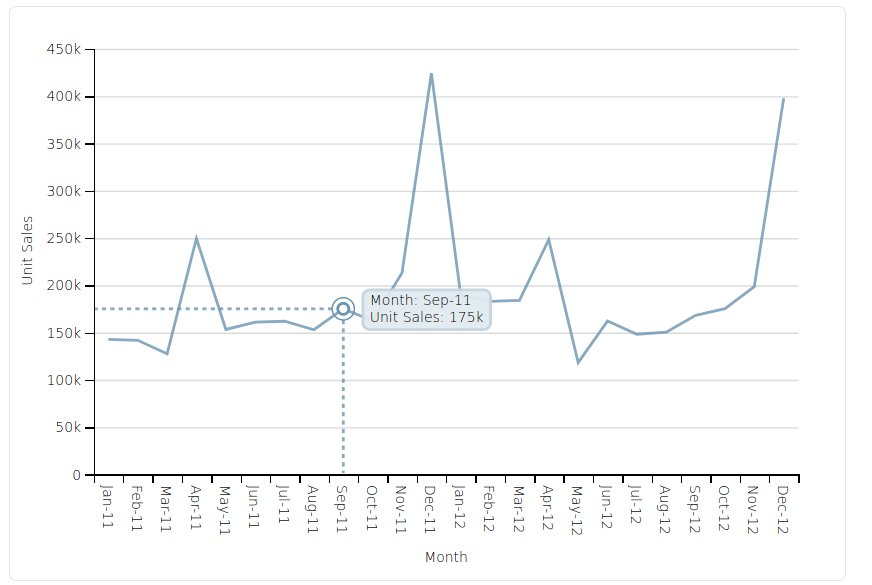
I found that while searching similar tools as D3.js and came up on dimple which uses D3 but with less lines of code.
At dimple example line chart moving the mouse on a data point will render a tooltip with such lines.

But I had already spent quite amount of time for plain d3 to work and the concept of starting all over again for that tooltip was not appealing. The harder way to implement that on my current d3 solution led to even more time spent searching.
Tooltip definition
Tooltip is defined as a seperate <div> element inside the chart’s <div>. Initially it is transparent(opacity: 0), and once cursor moves over a point it is set to 1 to be visible.
var tooltip = d3.select(".d3line")
.append("div")
.style("opacity", 0)
.attr("class", "tooltip")
.style("background-color", "aquamarine")
.style("border", "solid")
.style("border-width", "1px")
.style("border-radius", "5px")
.style("padding", "10px")
.style("pointer-events", "none")
.style("position", "absolute")
In similar to tooltip,definition of animated lines from point to axis follow the same rule with their opacity set to 0.
var x_cord_line = svg.append('line')
  .style("stroke", "aquamarine")
  .style("stroke-dasharray", "3 3")
  .style("opacity", 0)

var y_cord_line = svg.append('line')
  .style("stroke", "aquamarine")
  .style("stroke-dasharray", "3 3")
  .style("opacity", 0)
To track the mouse while it is over a point, a small circle was appended over each point which calls the functions mouseover, mousemove, mouseleave which handle the rendering. While the cursor stays withing the radius 5 circle upon a point, the tooltip will be displayed.
 svg.selectAll(".dot")
     .data(dataset)
 .enter().append("circle") // Uses the enter().append() method
     .attr("class", "dot") // Assign a class for styling
     .attr("cx", function(d) { return xScale(d.time) })
     .attr("cy", function(d) { return yScale(d.depth) })
+    .attr("r", 5)
+    .style("pointer-events", "all")
+    .on('mouseover', mouseover)
+    .on('mousemove', mousemove)
+    .on('mouseout', mouseleave);
mouseover & mouseleave functions handles the opacity to enable/disable the tooltip and animated lines when cursor is inside or moves away from the point circle respectively.
var mouseover = function(d) {
tooltip
  .style("opacity", 1)
  .style("display", "block")
x_cord_line
  .style("opacity", 1)
y_cord_line
  .style("opacity", 1)
}

var mouseleave = function(d) {
tooltip
  .transition()
  .duration(200)
  .style("opacity", 0)
  .style("display", "none")
x_cord_line
  .transition()
  .duration(200)
  .style("opacity", 0)
y_cord_line
  .transition()
  .duration(200)
  .style("opacity", 0)
}
Rendering is handled by mousemove function which defines:
- tooltip contents and its position relatively to the size of svg chart so that it stays near the point when the chart is resized, althouth the application is not yet responsive.
- start & end points alongside the transition speed of animated lines
var mousemove = function(d) {
svgDim = svg.node().getBoundingClientRect();
tooltip
  .html("Depth: " + d.depth + " m" + "<br>" + "Runtime (RT): " + d.time + "'")
  .style("left", ((d3.mouse(this)[0]+90) * ((svgDim.width+90) / 1478)) + "px")
  .style("top", ((d3.mouse(this)[1]-20) * ((svgDim.height-20) / 770)) + "px")
x_cord_line
    .attr("y1", yScale(d.depth))
    .attr("x1", xScale(d.time))
    .attr("y2", yScale(d.depth))
    .attr("x2", xScale(d.time))
    .transition()
    .duration(600)
    .attr("y2", yScale(dataset[0].depth + 5))
    .attr("x2", xScale(d.time))
y_cord_line
    .attr("y1", yScale(d.depth))
    .attr("x1", xScale(d.time))
    .attr("y2", yScale(d.depth))
    .attr("x2", xScale(d.time))
    .transition()
    .duration(600)
    .attr("y2", yScale(d.depth))
    .attr("x2", xScale(0))
}
